Wall Street Markets vs. Main Street Consumers: Who will Win?
5 Economic Warning Signs You Might Be Missing
Navigating the modern economy feels like deciphering a code, with stock market rallies often masking deeper signs of a slowdown. To understand the true direction of the economy, it's often more revealing to look beyond the daily headlines at a few key underlying indicators. The following five points, drawn from recent economic data, reveal a consistent and cautionary story about where the economy may be heading.
1. Consumer Confidence Has Fallen Off a Cliff
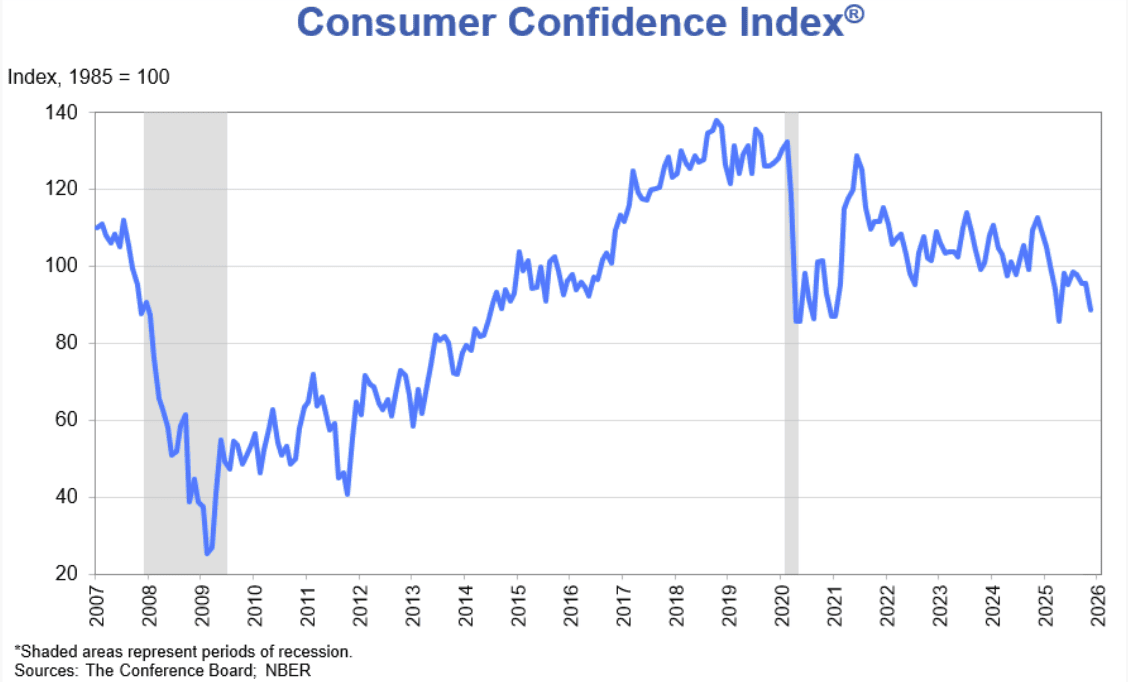
A major survey of consumer sentiment revealed a sharp decline in November 2025, a worrying sign for an economy driven by spending. The Conference Board Consumer Confidence Index® declined by 6.8 points to 88.7, its lowest level since April. A critical component of that report, the Expectations Index, which measures the short-term outlook for income, business, and labor conditions, has been particularly weak. This index has now tracked below the recession-signaling threshold of 80 for ten consecutive months.
"Consumer confidence tumbled in November to its lowest level since April after moving sideways for several months." - Dana M Peterson, Chief Economist at The Conference Board
This matters because consumer sentiment is a key driver of spending. Such deep pessimism signals that households may be preparing to pull back, posing a significant headwind for economic growth.
2. A Key Recession Predictor Is Flashing Red
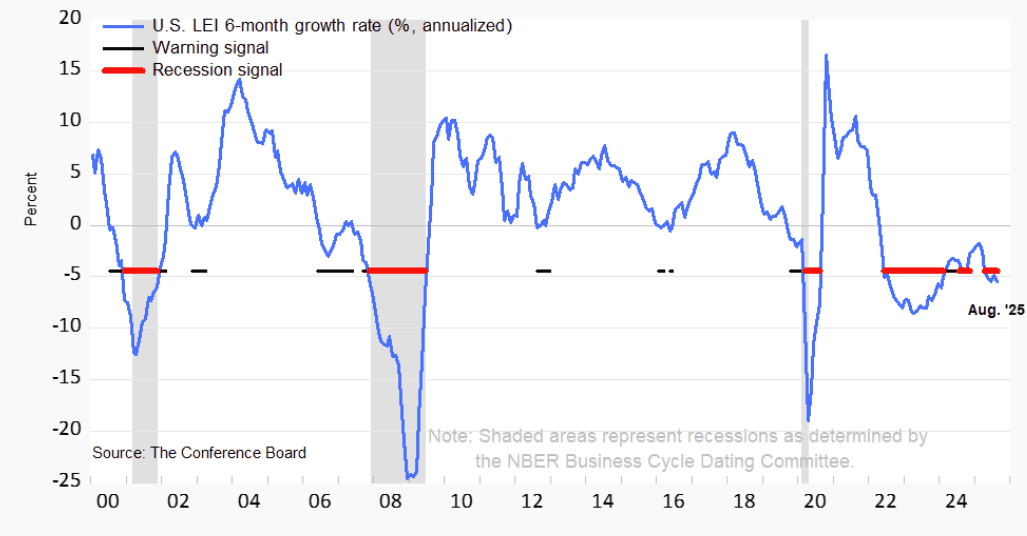
The Conference Board Leading Economic Index® (LEI) is a composite index designed to signal turning points in the business cycle before they happen. In August 2025, the LEI for the US declined by 0.5% and fell by a total of 2.8% over the preceding six months. Crucially, the report notes that this widespread weakness across its components triggered a "recession signal" in August.
“In August, the US LEI registered its largest monthly decline since April 2025, signaling more headwinds ahead.” - Justyna Zabinska-La Monica, Senior Manager, Business Cycle Indicators, at The Conference Board
Because this single indicator combines ten different data points—from manufacturing orders to stock prices and unemployment claims—its unified negative signal is particularly impactful.
3. America's Factories Have Room to Spare
Capacity utilization is a key measure of economic health that shows how much of the nation's industrial potential is actually being used. In August 2025, the total capacity utilization rate for the U.S. industrial sector was 77.4 percent. This rate is significant because it is 2.2 percentage points below its long-run average from 1972–2024, indicating that the country's industrial sector—comprising manufacturing, mining, and utilities—is operating with significant slack, suggesting a lack of robust demand in the economy.
4. The Job Market Shows Subtle Signs of Strain
To get a nuanced view of the labor market, it's important to distinguish between the two main types of weekly unemployment claims.
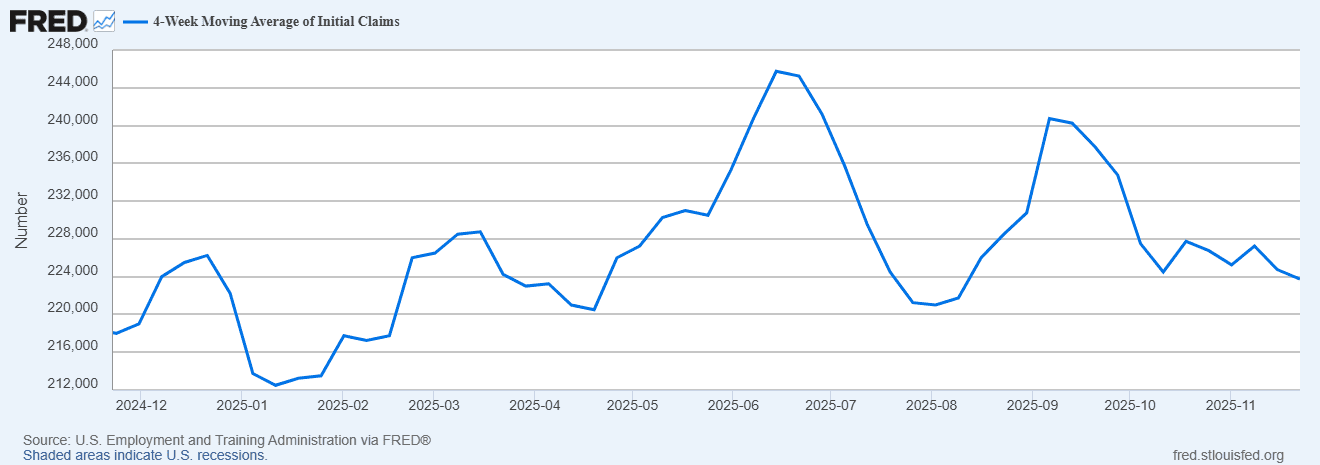
First, "initial claims" represent new applications for unemployment benefits, giving us a real-time look at the pace of recent layoffs. As of November 15, 2025, the 4-week moving average for these new claims was a relatively stable 224,250.
First, "initial claims" represent new applications for unemployment benefits, giving us a real-time look at the pace of recent layoffs. As of November 15, 2025, the 4-week moving average for these new claims was a relatively stable 224,250.
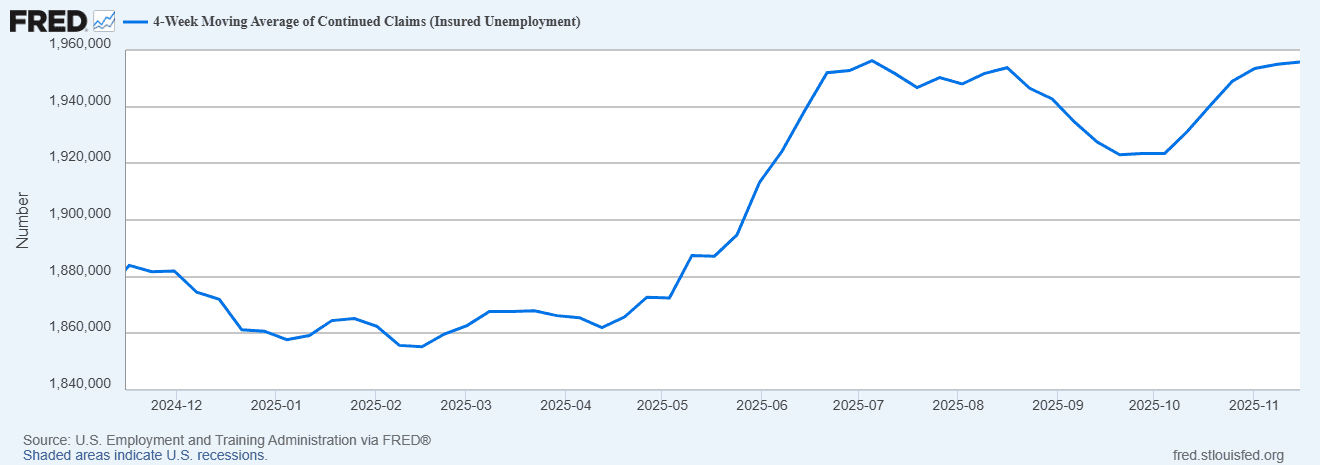
Second, "continued claims" represent the total number of individuals already receiving unemployment benefits. As of November 8, 2025, the 4-week moving average for continued claims was 1,960,250. While new layoffs are not spiking, the number of people remaining on unemployment is nearly 2 million and has been rising. This divergence signals a cooling hiring environment, where finding a new job is becoming a prolonged struggle for nearly two million Americans.
5. Wall Street's Optimism Isn't Reaching Main Street
There is often a sharp contrast between financial market performance and the economic reality for average households. On November 25, 2025, the S&P 500 Index provided a dose of good news, closing at 6,765.88, up 0.91% for the day.
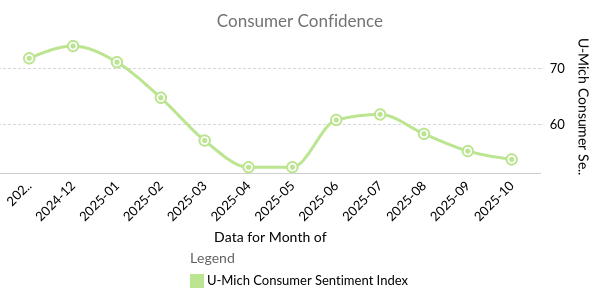
However, that optimism is not reflected in how most Americans feel about their finances. According to the University of Michigan Surveys of Consumers, the Index of Consumer Sentiment fell to just 51.0 in November, a staggering 29.0% drop from the previous year.
"...consumers remain frustrated about the persistence of high prices and weakening incomes."
Joanne Hsu, Surveys of Consumers Director
This highlights a significant disconnect between the performance of financial markets and the persistent anxieties—driven by high prices and stagnant incomes—that define the economic reality for millions of households.